Executive Summary
- Who this is for: Solution Architects, Enterprise Architects, Senior Engineers, Security Architects
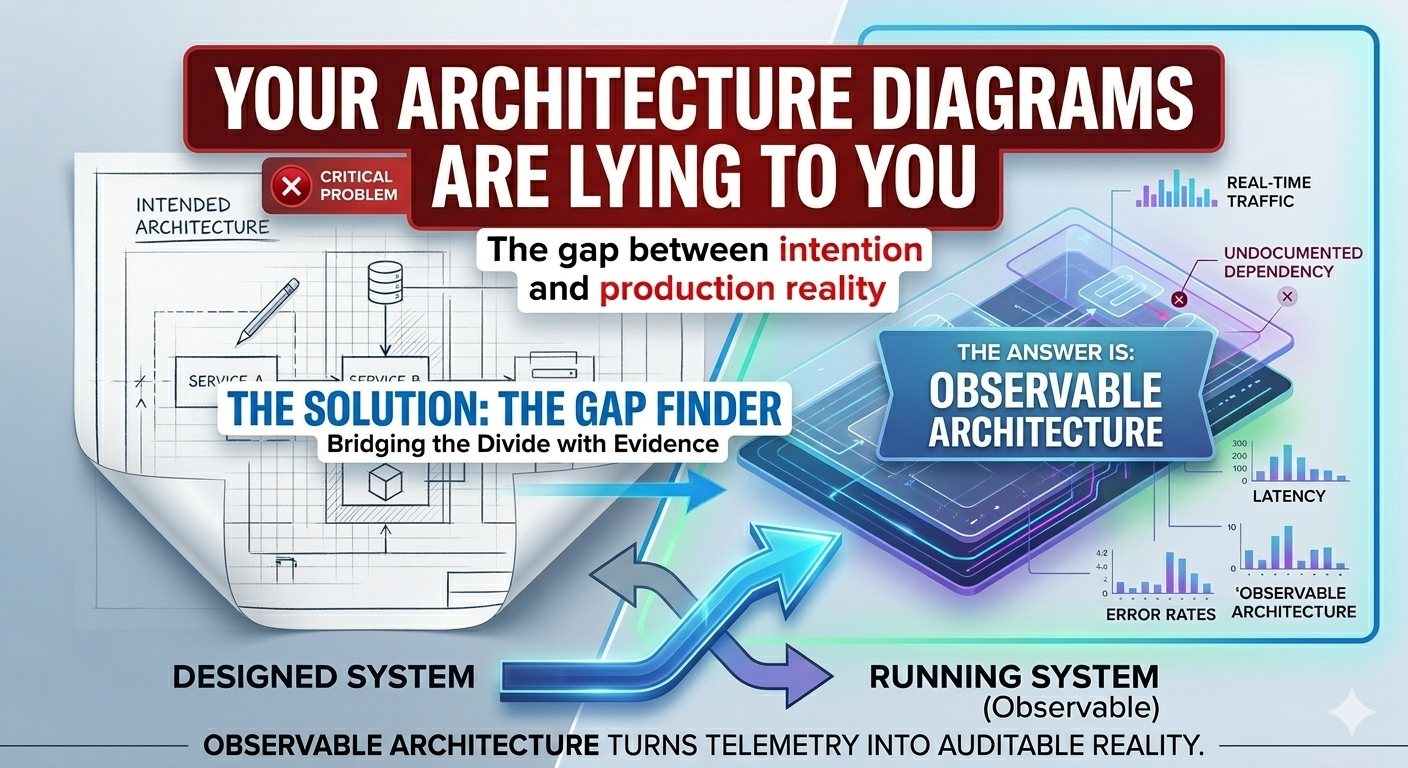
- Problem it solves: Architecture diagrams describe the intended system, not the running system — creating an invisible gap where risk concentrates
- Key outcome: A practical method to generate architecture views from production telemetry, revealing what is actually running
- Time to implement: 30–60 days to introduce Observable Architecture as a governance practice
- Business impact: Earlier risk detection, accurate security reviews, reduced production surprises, and architecture governance grounded in operational reality
The Diagram That Looked Complete
Every organization has one.
A clean architecture diagram.
Boxes with clear labels.
Arrows showing exactly how services communicate.
Color-coded by domain.
Approved by the architecture board.
Stored in Confluence.
Referenced in every design review.
And quietly, completely, wrong.
Not wrong because it was poorly designed.
Wrong because it was drawn once.
And systems do not stay still.
The Flight Plan and the Radar
Before every flight, a pilot files a flight plan.
Intended route. Altitude. Speed. Timing.
It is reviewed. Approved. Logged.
It describes exactly how the flight should proceed.
But air traffic control does not manage aircraft from flight plans.
They manage them from live radar.
Because aircraft deviate constantly.
Weather forces a route change.
An ATC instruction shifts the altitude.
A faster tailwind compresses the timing.
Another aircraft creates a conflict that the filed plan never anticipated.
The flight plan describes the intended flight.
Radar shows the actual one.
An ATC operation that tracked aircraft only from filed plans — without radar — would not be managing air traffic.
It would be managing assumptions.
That is precisely what architecture governance does when it relies on diagrams alone.
The Gap Where Risk Hides
Architecture diagrams are created at a moment in time.
They show the intended system.
But systems evolve faster than diagrams are updated.
A new integration gets added without a design review.
A library changes how it routes traffic internally.
A service starts calling another service it was never supposed to touch.
A team introduces a caching layer that nobody drew.
None of these changes are malicious.
Most are pragmatic decisions made at delivery speed.
But the diagram does not record them.
Over time, the official diagram and the running system quietly diverge.
What Architects Are Actually Governing
When the gap between diagram and reality grows, something important breaks.
Architecture reviews happen against the wrong picture.
Security threat models assess a system that does not exist.
Capacity planning models flows that were replaced eighteen months ago.
Impact assessments miss dependencies that never appeared in the design.
The architecture is being governed.
Just not the architecture that is running.
The Three Signals Hidden in Production
Production systems generate continuous signals that most architecture teams never examine.
Three signals are particularly valuable.
Every service call leaves a trace.
Service mesh telemetry and distributed tracing tools record:
- which services call which other services
- the frequency and volume of each call
- latency and failure rates per path
This data reveals the actual communication topology of the system.
Not the planned one.
2. Undocumented Dependencies
Traces often reveal integrations that exist nowhere in official documentation.
Examples:
- a frontend service calling a backend it was never designed to reach
- a shared library creating an implicit dependency between two supposedly isolated domains
- a third-party service receiving data from a module that should have no external connectivity
These are not visible in architecture diagrams.
They are visible in production telemetry.
3. Traffic Distribution
Architecture diagrams typically show clean, symmetric flows.
Production telemetry shows the reality:
- which paths carry 90% of the load
- which designed redundancy paths are never used
- which failure modes appear regularly but are absent from design documentation
The gap between the symmetric diagram and the asymmetric reality is exactly where incidents originate.
The flight plan looked correct.
The radar showed a different aircraft.
Observable Architecture (OA)
To close this gap, architecture practice needs a new discipline.
Observable Architecture (OA).
Observable Architecture is the practice of continuously generating and reviewing architecture views derived from production telemetry rather than — or alongside — design documentation.
In Observable Architecture, the primary question shifts.
From:
Does our system match the diagram?
To:
What does the system actually look like, and where does it differ from what we intended?
The Observable Architecture Model
Observable Architecture operates across three layers.
Layer 1: Signal Collection
Collect the production signals that reveal real system behaviour.
Sources include:
- distributed tracing (service call paths and dependencies)
- service mesh telemetry (traffic volumes, failure rates, latency per path)
- API gateway logs (entry points and actual routing patterns)
- runtime dependency scanners (libraries, packages, implicit bindings)
Most organizations already generate these signals.
Very few direct them toward architecture governance.
Layer 2: Topology Generation
Transform collected signals into an architecture view.
This view shows:
| Signal | Architecture Insight |
|---|---|
| Service-to-service traces | Actual communication topology |
| Call frequency and volume | Real traffic distribution |
| Undocumented service calls | Hidden dependencies |
| Third-party connections | External integrations outside design |
| Error path traces | Failure topology invisible in diagrams |
The generated view is not a replacement for the intended architecture diagram.
It is a counterpart.
Placed side by side, the two reveal the gap.
Layer 3: Gap Analysis
Compare the intended architecture against the observable architecture.
Look for three types of divergence.
New dependencies — connections that appear in telemetry but not in diagrams.
Missing dependencies — designed connections that production telemetry shows are unused or broken.
Load distribution drift — traffic patterns that contradict the designed flow assumptions.
Each divergence is an architectural finding.
Some are benign.
Some are security risks.
Some are the precise cause of the last production incident.
What Breaks When This Is Ignored
When architecture governance relies only on intended diagrams:
Security reviews assess the wrong surface.
A threat model built on the designed architecture misses undocumented service connections, unintended data paths, and external integrations nobody drew. The attack surface the review did not examine is the one an attacker will find.
Impact assessments mislead delivery teams.
A team changing a service is told it has three downstream dependencies. Production telemetry shows seven. The impact assessment was accurate for the diagram. Not for the system.
Incidents produce surprises that should not surprise anyone.
When production fails, the post-mortem maps the incident back to a dependency that "shouldn't have existed." That dependency existed in telemetry for months. Nobody looked.
When Observable Architecture is in place:
Architecture reviews incorporate production evidence alongside design intent.
Security teams model the actual attack surface.
Impact assessments reflect operational reality.
Incidents become explainable before they become expensive.
Implementation Guide (30–60 Days)
Introducing Observable Architecture does not require replacing existing tools.
It requires directing existing signals toward architecture governance.
Phase 1: Activate Signal Collection (Weeks 1–2)
Identify production signals already available in your environment.
Most organizations have at least one of the following already operating:
- distributed tracing (Jaeger, Zipkin, OpenTelemetry)
- service mesh observability (Istio, Linkerd, Consul)
- API gateway analytics
- cloud provider network flow logs
Map each signal source to the architecture insight it produces.
Deliverable: Signal inventory mapped to architecture insight categories
Success Metric: At least two signal sources identified and accessible for architecture analysis
Phase 2: Generate the First Observable View (Weeks 3–4)
Select one domain or system boundary.
Extract service call topology from available telemetry for that domain.
Place the generated topology alongside the existing architecture diagram.
Document every divergence found.
Deliverable: First observable architecture view for one domain, with gap analysis findings
Success Metric: At least one undocumented dependency identified and escalated as an architecture finding
Phase 3: Embed into Architecture Governance (Weeks 5–8)
Integrate observable architecture views into the standard governance cycle.
Architecture reviews should include:
- the intended architecture diagram
- the observable architecture view from the most recent telemetry snapshot
- a gap register documenting known divergences and their risk classification
Define when a gap requires remediation versus when it is an accepted deviation.
Deliverable: Observable architecture review process embedded in architecture governance
Success Metric: At least one governance decision — remediation, exception, or design update — produced from observable architecture evidence rather than diagram review alone
Evidence from Practice
When organizations run their first Observable Architecture analysis, the findings follow a recognizable pattern.
The first surprise is the number of undocumented service connections.
Systems that were designed with clear boundaries consistently show connections in production that appear nowhere in the architecture diagram.
Some were added deliberately and never documented.
Some emerged from shared libraries creating implicit bindings.
Some are the result of configuration decisions that had architectural consequences nobody noticed.
The second surprise is what is missing.
Designed redundancy paths that have never carried traffic.
Failover routes that exist in diagrams but are unreachable in production due to network configuration drift.
Architecture designed for resilience that has never been tested by the actual system.
The diagram looked complete.
The system told a different story.
Action Plan
This Week
Ask three questions:
- When was your most critical architecture diagram last updated based on production evidence — not design intent?
- Does your security threat model reflect actual service connections, or the connections shown in the approved design?
- Could you identify every service your most important system actually calls right now — without looking at the diagram?
If these answers are unclear, your architecture governance may be operating against a fiction.
Next 30 Days
Select one system.
Extract its service call topology from production telemetry.
Place that view alongside the existing architecture diagram.
Document every divergence.
That gap is your architecture risk register.
3–6 Months
Introduce Observable Architecture as a standard input to architecture reviews.
Require that major impact assessments and security reviews include a telemetry-derived view of the affected system.
Architecture governance becomes more reliable when it reflects how systems actually run.
Not how they were designed to run.
Final Thought
The flight plan was accurate.
When it was filed.
The aircraft kept moving.
The plan did not.
Governance built on a filed plan does not manage the flight.
It manages the intention of the flight.
Observable Architecture closes that gap.
Not by replacing design intent.
But by holding it accountable to what is actually in the air.
Understand the System That Is Actually Running
If your architecture diagrams have not been validated against production telemetry…
if security reviews are built on design documentation rather than actual service connections…
or if production incidents regularly reveal dependencies that nobody designed —
your architecture governance may be working from an incomplete picture.
In a focused 30-minute Observable Architecture Diagnostic, we will:
- Identify the gap between your intended and running architecture
- Evaluate which production signals are already available for architecture analysis
- Introduce a practical Observable Architecture model for your environment
- Define a 30-day plan to embed telemetry-derived views into architecture governance
No complex tooling overhaul.
No architecture theater.
No governance that replaces production evidence with design assumptions.
Just architecture governance that reflects the system as it runs.
→ Book an Architecture Strategy Session
or
The diagram shows the system you designed.
The telemetry shows the system you have.
The gap between them is where the next incident is waiting.