Executive Summary
- Who this is for: Enterprise Architects, CTOs, Architecture Leads, Architecture Governance Teams
- Problem it solves: Traditional capability maps are static diagrams that cannot answer governance questions
- Key outcome: A method to turn capability maps into queryable architecture intelligence
- Time to implement: 30–60 days to build a structured queryable capability model
- Business impact: Better governance decisions, clearer ownership visibility, reduced technology duplication, and improved investment alignment
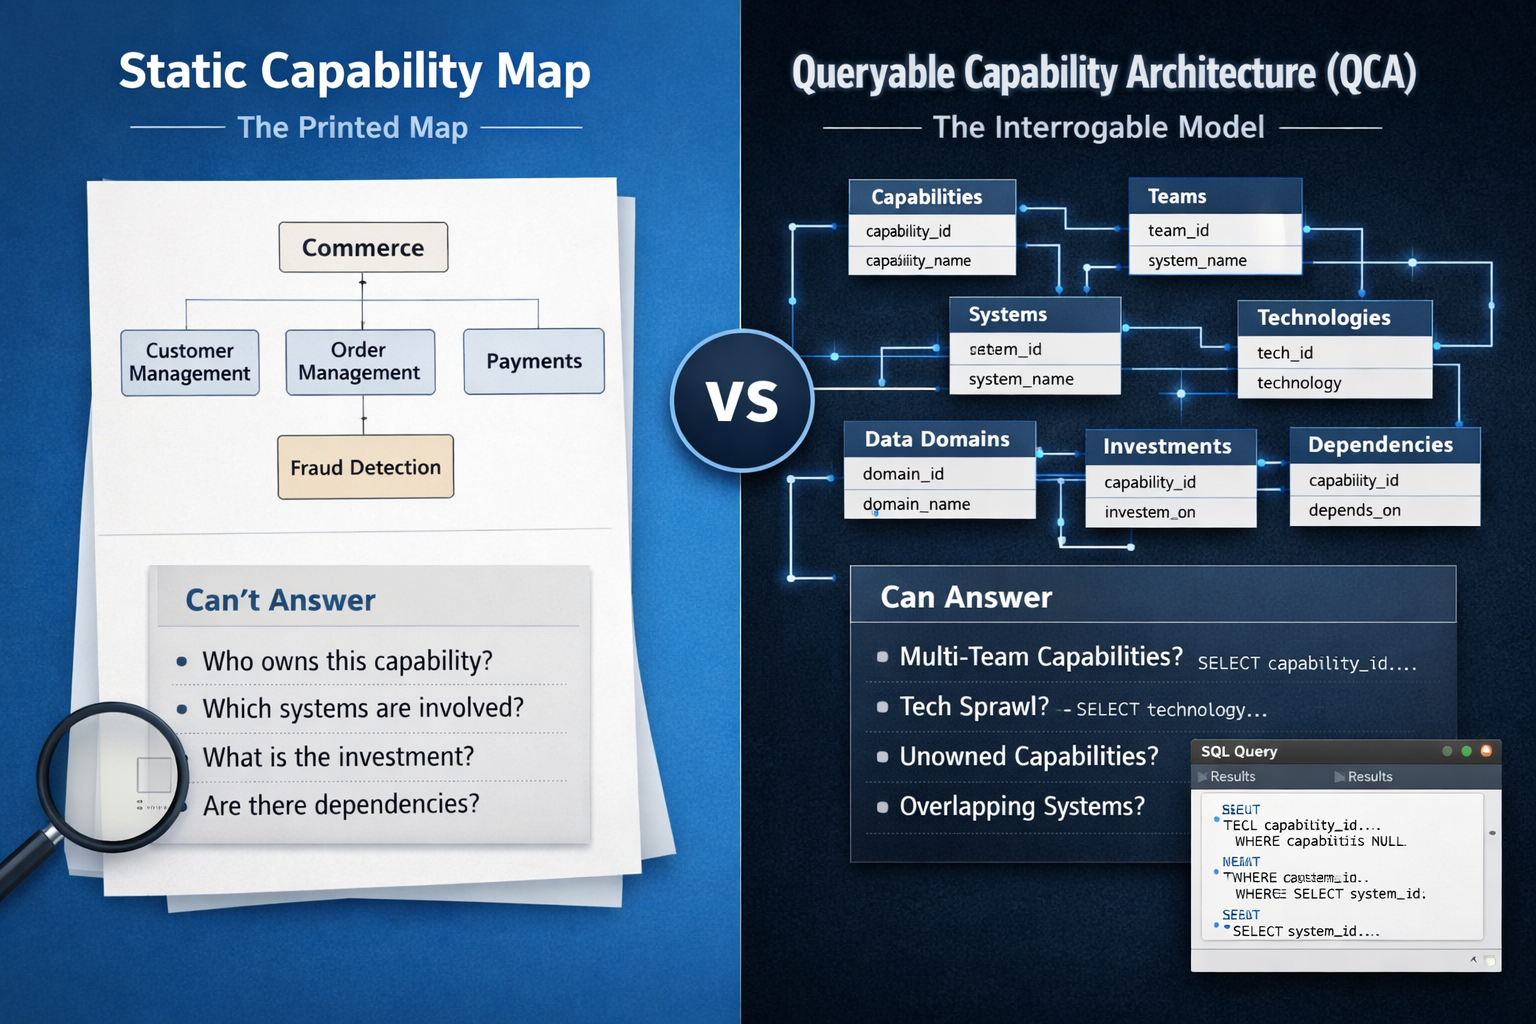
The Capability Map Illusion
Almost every large organization maintains a capability map.
It usually appears in architecture presentations as a structured diagram showing areas such as:
- Customer Management
- Order Processing
- Payments
- Logistics
- Analytics
These maps are widely used in:
- enterprise architecture documentation
- digital transformation programs
- technology strategy discussions
- portfolio prioritization
At first glance they appear extremely useful.
But there is a hidden problem.
Most capability maps cannot answer even the simplest governance question.
For example:
- Which capabilities are owned by more than one team?
- Which capabilities have no supporting system?
- Which capabilities receive the largest technology investment?
- Which capabilities depend on fragile legacy platforms?
If the map cannot answer these questions, it is not functioning as a governance tool.
It is functioning as a picture.
The City Planning Analogy
Imagine two city planners. Same city. Same infrastructure. Different tools.
The First Planner: A Printed Map
A large printed map shows:
- roads
- water pipelines
- electrical grids
- communication networks
It provides a useful overview.
But if the planner asks:
- Which pipelines serve more than two districts?
- Which power lines support hospitals?
- Which roads carry load from three boroughs simultaneously?
The printed map cannot answer.
Someone must manually inspect the diagram.
The Second Planner: A GIS System
The same infrastructure stored in a GIS system.
The planner runs queries:
- show pipelines serving more than three districts
- identify infrastructure assets older than twenty-five years
- list districts dependent on a single power line
The underlying information is identical.
But the decision capability is completely different.
Most enterprise capability maps still operate at the printed map stage.
The Governance Visibility Problem
Traditional capability maps are usually stored as:
- PowerPoint diagrams
- architecture modeling tools used primarily for visualization
- spreadsheets listing capabilities with owners
These artifacts capture structure but not relationships that can be interrogated.
As a result, several governance questions remain impossible to answer cleanly.
Multiple teams may claim responsibility for the same capability.
This creates:
- duplicated systems
- inconsistent standards
- unclear accountability
Static maps rarely surface these conflicts.
Capability Redundancy
Organizations often build multiple platforms supporting the same capability without realizing it.
Without structured analysis, this duplication stays hidden.
Capability Gaps
Some capabilities appear on strategy maps but lack:
- a supporting system
- a responsible team
- a delivery roadmap
These capabilities exist only in presentation slides, not in operational reality.
Investment Concentration
Technology budgets often concentrate in certain capability areas.
But static capability maps rarely show:
- investment per capability
- technology footprint per capability
- operational risk per capability
Strategic decisions get made from incomplete information.
Queryable Capability Architecture (QCA)
To solve this problem, capability maps must evolve.
Instead of static diagrams, they should become queryable architecture models.
This idea can be described as:
Queryable Capability Architecture (QCA).
In QCA, capabilities are not visual blocks on a slide.
They are data entities stored in a structured model that can be interrogated.
This allows architects to query relationships between:
- capabilities and teams
- capabilities and systems
- capabilities and technologies
- capabilities and investments
Architecture becomes interrogable organizational intelligence.
The Core Data Structure
A practical QCA model contains several connected entities.
Capability Table
Represents what the business does.
| capability_id | capability_name | parent_capability | business_domain |
|---|---|---|---|
| C01 | Customer Management | NULL | Commerce |
| C02 | Order Management | NULL | Commerce |
| C03 | Payment Processing | NULL | Commerce |
| C04 | Fraud Detection | C03 | Risk |
Team Table
Represents organizational ownership.
| team_id | team_name | department |
|---|---|---|
| T01 | Commerce Platform | Engineering |
| T02 | Customer Experience | Product |
| T03 | Risk Systems | Engineering |
Capability Ownership Mapping
| capability_id | team_id | responsibility |
|---|---|---|
| C01 | T02 | Primary |
| C02 | T01 | Primary |
| C02 | T02 | Shared |
| C03 | T01 | Primary |
This immediately reveals:
- capabilities with multiple owners
- capabilities with no assigned owner
System Table
Represents applications implementing capabilities.
| system_id | system_name | system_type | vendor |
|---|---|---|---|
| S01 | Salesforce CRM | SaaS | Salesforce |
| S02 | Order Engine | Custom | Internal |
| S03 | Payment Gateway | SaaS | Stripe |
Capability-System Mapping
| capability_id | system_id |
|---|---|
| C01 | S01 |
| C02 | S02 |
| C03 | S03 |
This reveals:
- which capabilities rely on which platforms
- which systems support multiple capabilities simultaneously
Investment Table
| capability_id | yearly_investment |
|---|---|
| C01 | $4M |
| C02 | $6M |
| C03 | $3M |
This enables analysis of:
- which capabilities receive the largest investments
- which capabilities are strategically critical but underfunded
Governance Questions Become Queries
Once this structure exists, the questions that static maps cannot answer become simple queries.
Detect Multi-Team Ownership
SELECT capability_id
FROM capability_ownership
GROUP BY capability_id
HAVING COUNT(team_id) > 1;
Surfaces ownership conflicts before they become delivery failures.
Identify Capabilities Without Systems
SELECT capability_name
FROM capability
LEFT JOIN capability_system
ON capability.id = capability_system.capability_id
WHERE capability_system.system_id IS NULL;
Reveals capabilities that exist in strategy but not in operational reality.
Detect Technology Redundancy
SELECT system_id, COUNT(capability_id) AS capability_count
FROM capability_system
GROUP BY system_id
HAVING COUNT(capability_id) > 3;
Identifies platforms carrying disproportionate system load.
Surface Investment Gaps
SELECT c.capability_name, i.yearly_investment
FROM capability c
LEFT JOIN investment i ON c.capability_id = i.capability_id
ORDER BY i.yearly_investment ASC;
Shows where strategic capabilities are underfunded.
What Breaks When This Is Ignored
When capability ownership cannot be queried:
- Two teams build parallel solutions to the same problem without knowing
- Delivery failures get attributed to technology when the real cause is ownership conflict
- Architecture reviews debate symptoms without reaching the structural cause
When investment cannot be mapped to capabilities:
- Critical capabilities go unfunded because they are invisible in budget discussions
- Funding concentrates in loud capabilities, not strategically important ones
- Rationalisation programmes cut systems without understanding which capabilities lose support
When QCA is in place:
- Ownership conflicts surface before they become delivery conflicts
- Investment decisions are made with dependency visibility, not intuition
- Governance shifts from reactive review to proactive intelligence
Implementation Guide (30–60 Days)
Introducing QCA requires structure more than technology.
Phase 1: Build the Schema (Weeks 1–2)
Define the core entities:
- Capability
- Team
- System
- Investment
Populate one business domain completely before expanding.
Deliverable: Schema agreed and one domain fully seeded
Success Metric: 25+ capabilities entered with ownership and system linkage
Phase 2: Run the Four Governance Queries (Weeks 3–4)
Execute each query against the populated domain:
- ownership conflict query
- capability gap query
- system load query
- investment alignment query
Document every finding.
Deliverable: Governance findings report per domain
Success Metric: At least one ownership conflict identified and escalated as an ADR
Phase 3: Expand and Embed (Weeks 5–8)
Extend QCA to all business domains.
Integrate query output into:
- quarterly investment reviews
- architecture review board cycles
- new project initiation documents
Deliverable: Full enterprise capability model in QCA format
Success Metric: At least two investment or governance decisions informed by QCA output
Evidence from Practice
Organizations that run QCA for the first time almost always find the same thing.
The ownership query surfaces more conflicts than anyone expected.
Not because of negligence — but because ownership was assumed, not assigned. The assumption held until the first cross-team dependency made it visible.
The investment query produces a different surprise.
The capabilities carrying the most dependency rarely receive the most investment. Loud capabilities attract funding. Quiet load-bearing ones do not.
The spreadsheet map captured all of this.
It just could not say it.
Action Plan
This Week
Ask three questions:
- Can your current capability map tell you which capabilities have more than one owner — in under five minutes?
- Can it identify which capabilities have no supporting system?
- Can it show which capabilities receive investment but carry no strategic priority?
If the answer to any of these is no, your map is a picture, not a governance tool.
Next 30 Days
Select one business domain.
Rebuild its capability view in a relational structure using the QCA model.
Run the four governance queries.
Document every finding as an ADR candidate or governance action.
3–6 Months
Expand QCA across all domains.
Embed query output as standard input to quarterly investment review.
Make capability ownership a required field in every new project initiation document.
Final Thought
The map looked complete.
The ownership was assumed.
The conflict was invisible.
The delivery failed anyway.
A capability map that cannot be asked a question is not a governance tool.
It is a photograph of a problem you do not yet know you have.
Turn Your Capability Map Into a Governance Intelligence System
If your capability map cannot answer questions about ownership, investment, or system coverage…
if governance decisions are still made from diagrams instead of data…
or if ownership conflicts only surface when delivery has already failed —
your organization may be operating from a picture, not a system.
In a focused 30-minute Capability Architecture Diagnostic, we will:
- Evaluate whether your current capability model can answer governance questions
- Identify ownership conflicts and capability gaps invisible in your current map
- Introduce a practical QCA structure for your organization
- Define a 30-day implementation plan to make your capability map queryable
No complex tooling.
No architecture theater.
No six-month transformation programs.
Just a capability model that can actually answer the questions your business is asking.
→ Book an Architecture Strategy Session
or
The map looks complete.
The question is whether it can answer anything.